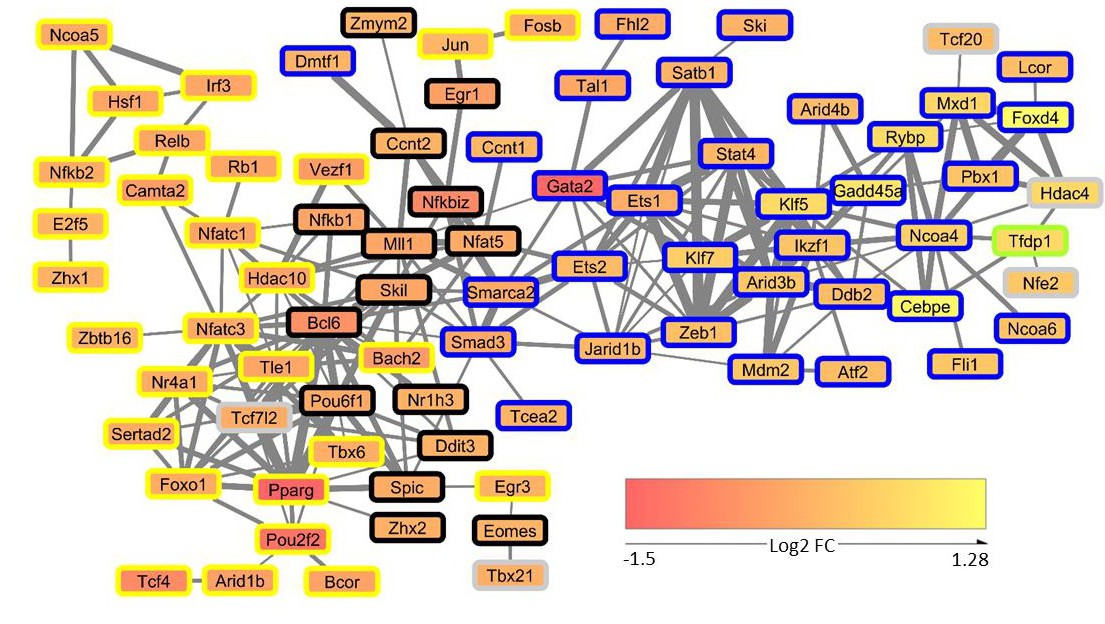
Fig. 5. Network of transcription factors from SOCS-1 dependent mRNA expression data. The expression data of transcription factors contained in the dataset were used for creating a transcription factor co-expression network using Biolayout Express3D. The network comprises all transcription factors (TFs) that correlate at least with one other TF with r2>0.85. The obtained network was visualized using Cytoscape. The edge thickness represents the correlation ranging from 0.85 to 0.97 and the node colors represent the log2-transformed FC detected in the SRL-/- vs RL-/- differential expression analysis (red: down-regulated, yellow: up-regulated). The TFs were further annotated with gene co-expression modules obtained from a weighted gene co-expression network analysis (WGCNA) using the global gene expression data set. Module membership is indicated by node border color.